New Release • Sessions + ORB + Daily Bias
Elev8+ Market Map: The One Overlay That Keeps You Oriented All Day
Most intraday traders don’t lose because they “can’t find entries.” They lose because they’re trading without a map. Elev8+ Market Map is a context overlay that lays out your session structure, key daily levels, ORB ranges, and a locked New York open bias snapshot—so you stop guessing and start trading from location. Use Market Map as your navigation layer, then use Elev8+ Pro reversal triangles as your execution trigger at the levels that actually matter.
Educational content only. Not financial advice. No performance guarantees.
Core idea
Trade from structure. Market Map highlights sessions, ORBs, PDH/PDL, and intraday “reaction lines” so you stop chasing mid-range candles.
What you get
Session boxes + session H/L liquidity lines, PDH/PDL, ORB boxes with alerts, session fib lines, and a daily bias dashboard at NY open.
Best combo
Use Market Map for where + when, then take Elev8+ Pro reversal triangles as the trigger only at mapped levels (sweeps, reclaims, ORB breaks, fib reactions).
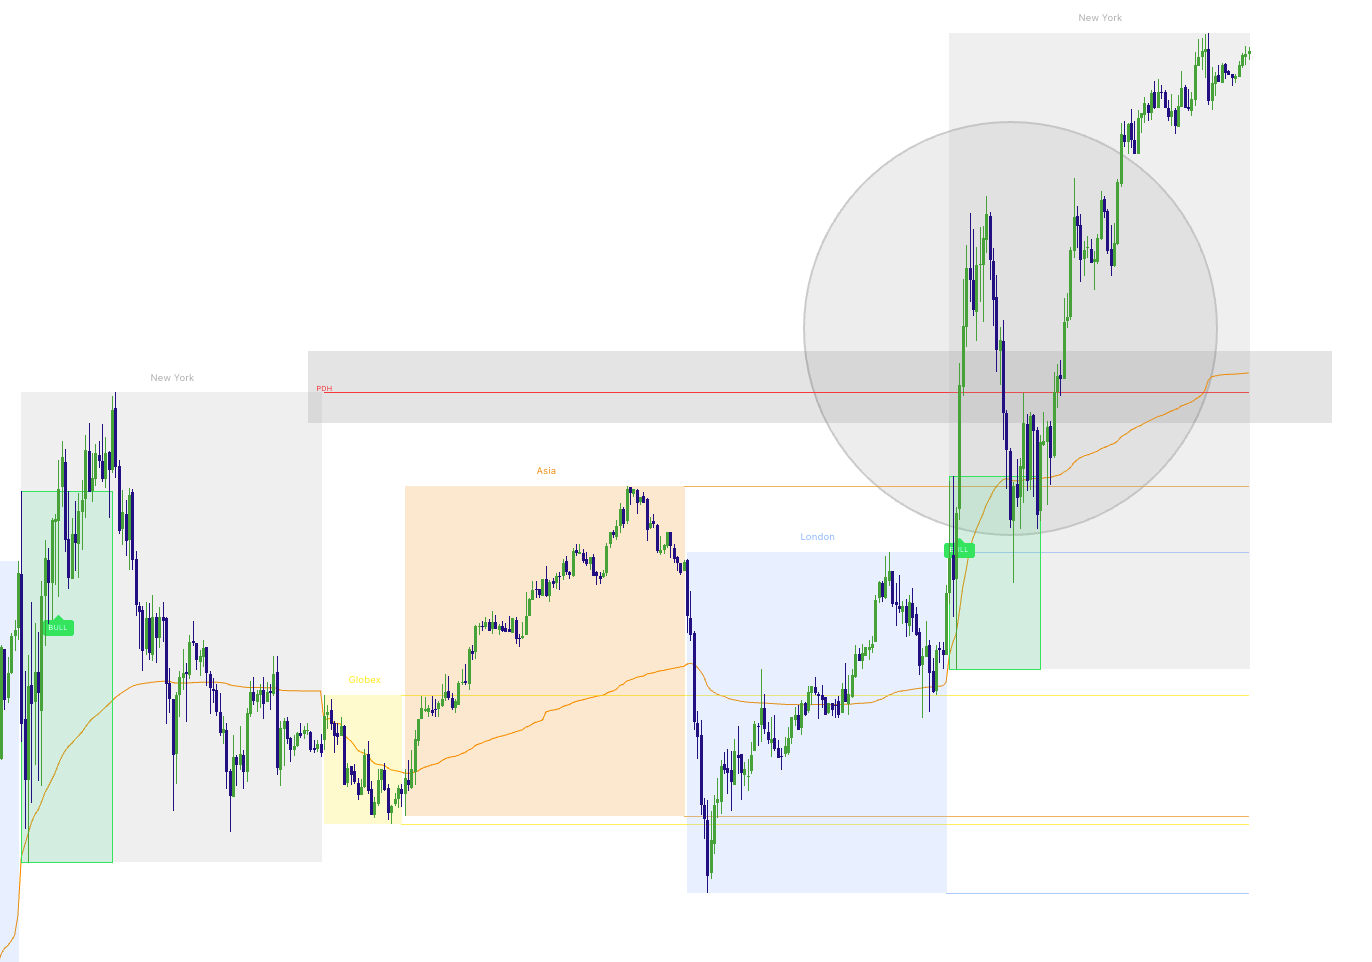
Image 1: Full Market Map overlay (NQ/ES • 1m or 5m)
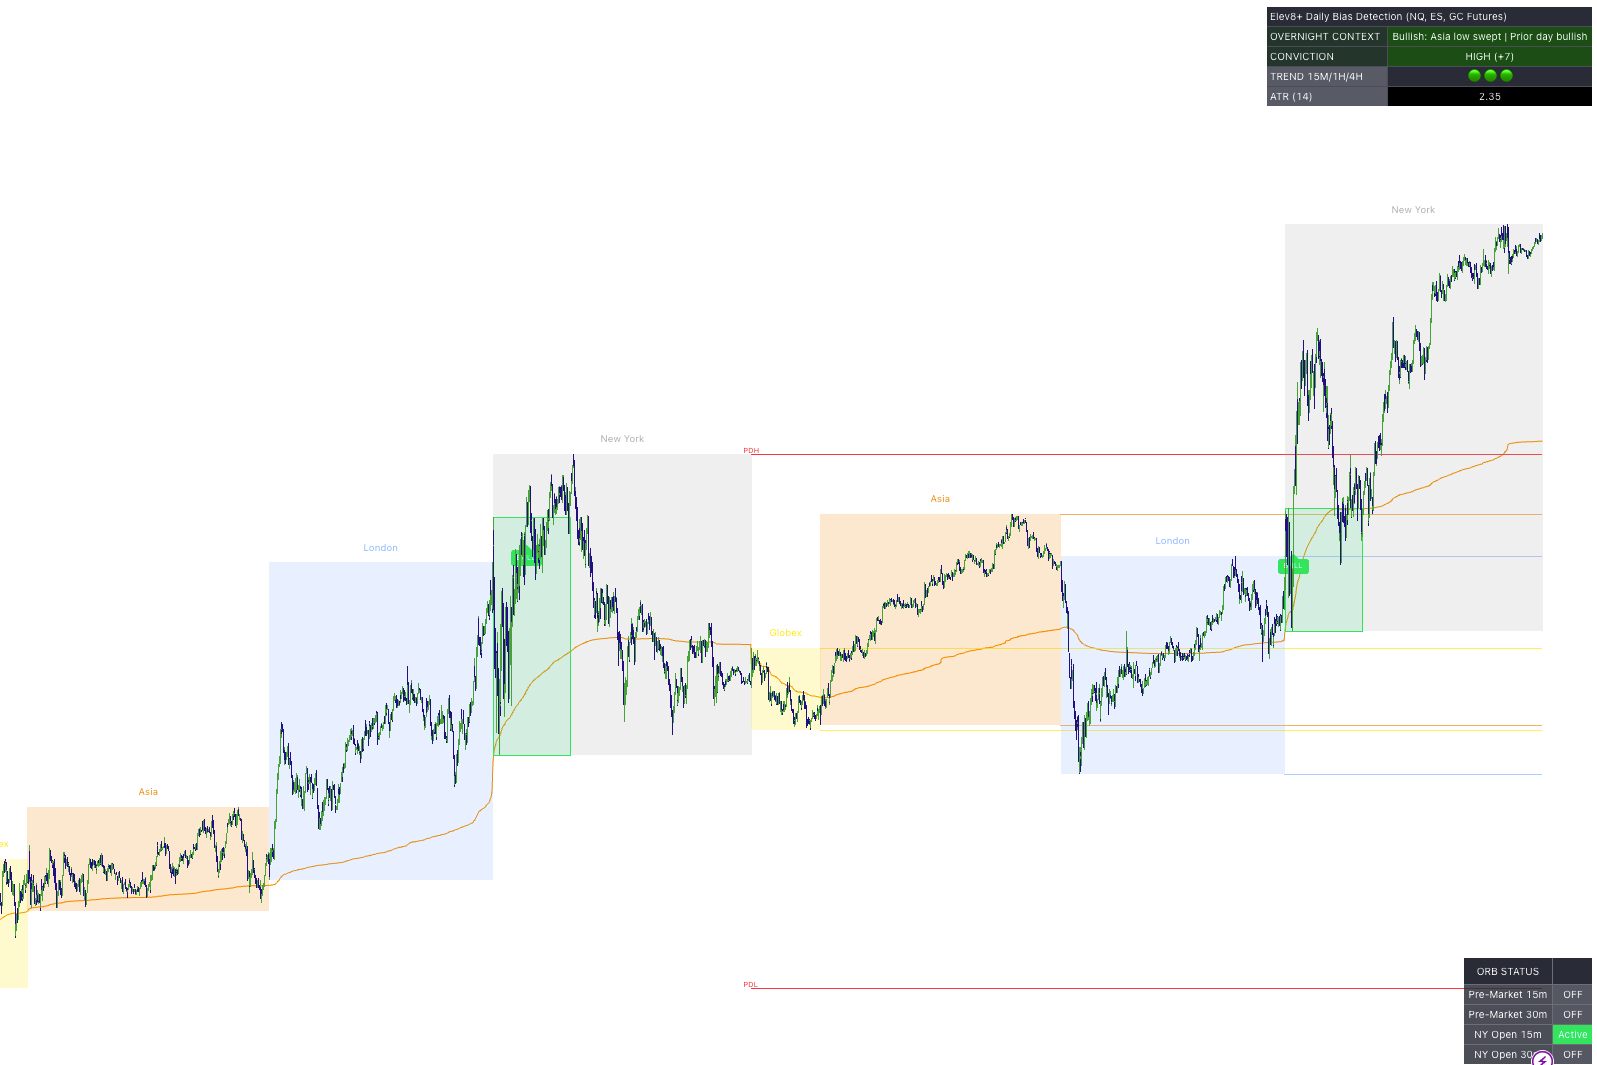
What Is Elev8+ Market Map?
Elev8+ Market Map is a chart overlay that turns a noisy intraday chart into a structured plan. It identifies where liquidity forms (session highs/lows), where the day’s key references are (PDH/PDL), and where breakout decisions happen (opening range boxes).
It’s intentionally not a “buy/sell indicator.” It’s a framework that helps you:
- stop taking trades in the middle of nowhere,
- focus on high-probability locations (sweeps, reclaims, ORB breaks),
- combine structure with an execution trigger (Elev8+ Pro triangles) for cleaner entries.
The correct mindset
Market Map = location + timing. Elev8+ Pro triangles = trigger. Your best trades are usually the ones where you can explain “why we should reverse here” in one sentence.
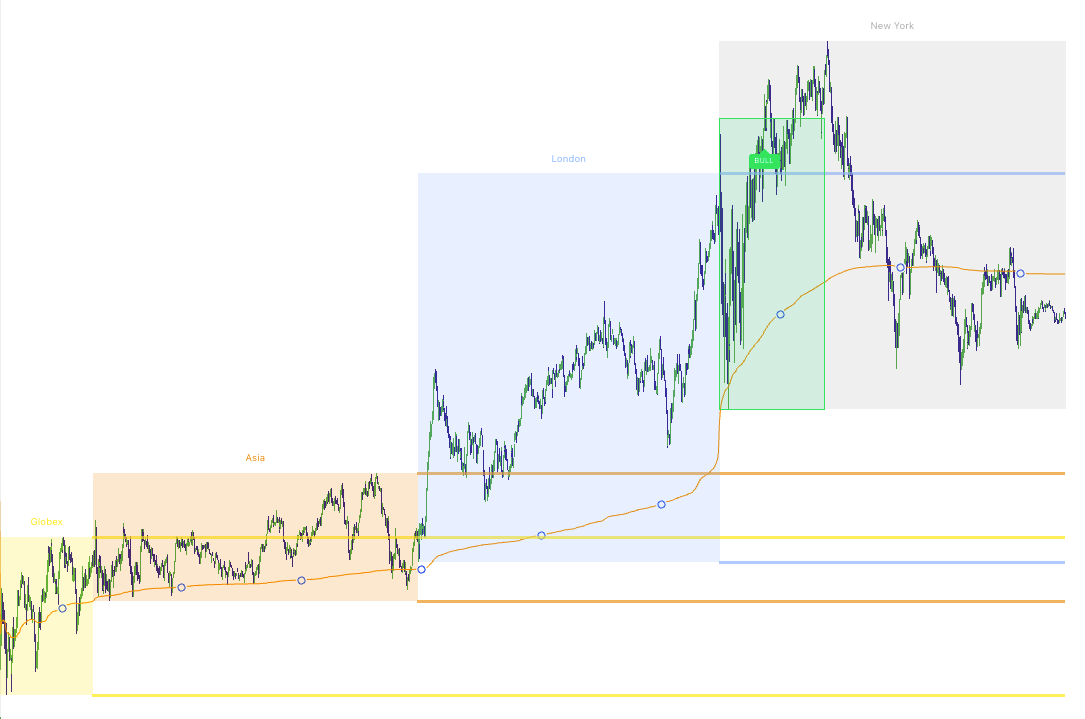
Step 1: Session Boxes + Session High/Low “Liquidity Lines”
The first layer of Market Map is simple: it visually marks the major sessions and tracks each session’s high and low. After a session completes, Market Map can extend those highs/lows forward as clean horizontal references—these are common areas where price may:
- sweep (pierce the level briefly and reverse),
- break and hold (acceptance),
- retest (support/resistance flip behavior).
Image 2: Asia + London session boxes with extended H/L lines
How to trade session highs/lows (two playbooks)
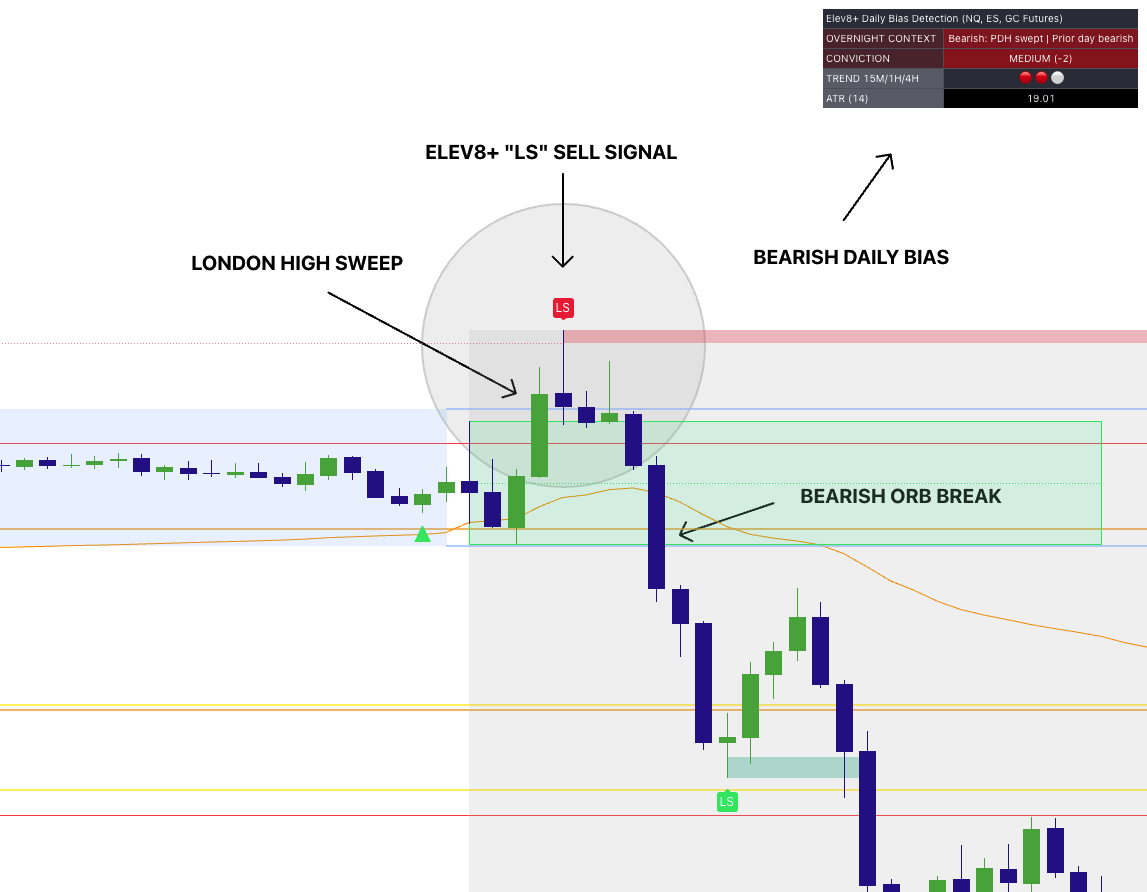
A) Sweep + Reclaim (reversal play)
A sweep is when price briefly runs a session high/low and then quickly fails back inside the prior range. That failure often becomes a high-quality reversal location—especially when you get a clean trigger.
- Bearish sweep idea: price pushes above a session high → fails back below → look for a Pro sell triangle or price stretching into a Market Extreme zone or creating divergence or Momentum Gap (could be on a different timeframe).
- Bullish sweep idea: price pushes below a session low → fails back above → look for a Pro buy triangle or price stretching into a Market Extreme zone or creating divergence or Momentum Gap (could be on a different timeframe).
B) Break + Hold (breakout continuation play)
If price breaks a session high/low and holds with clean closes or no clear rejection, it’s often showing acceptance. In that case, you treat the old level as a potential flip zone on retests especially if it also creates a Momentum Gap in the process that you could use as an entry.
- Breakout long idea: break above a session high → hold above → retest as support → continue.
- Breakout short idea: break below a session low → hold below → retest as resistance → continue.
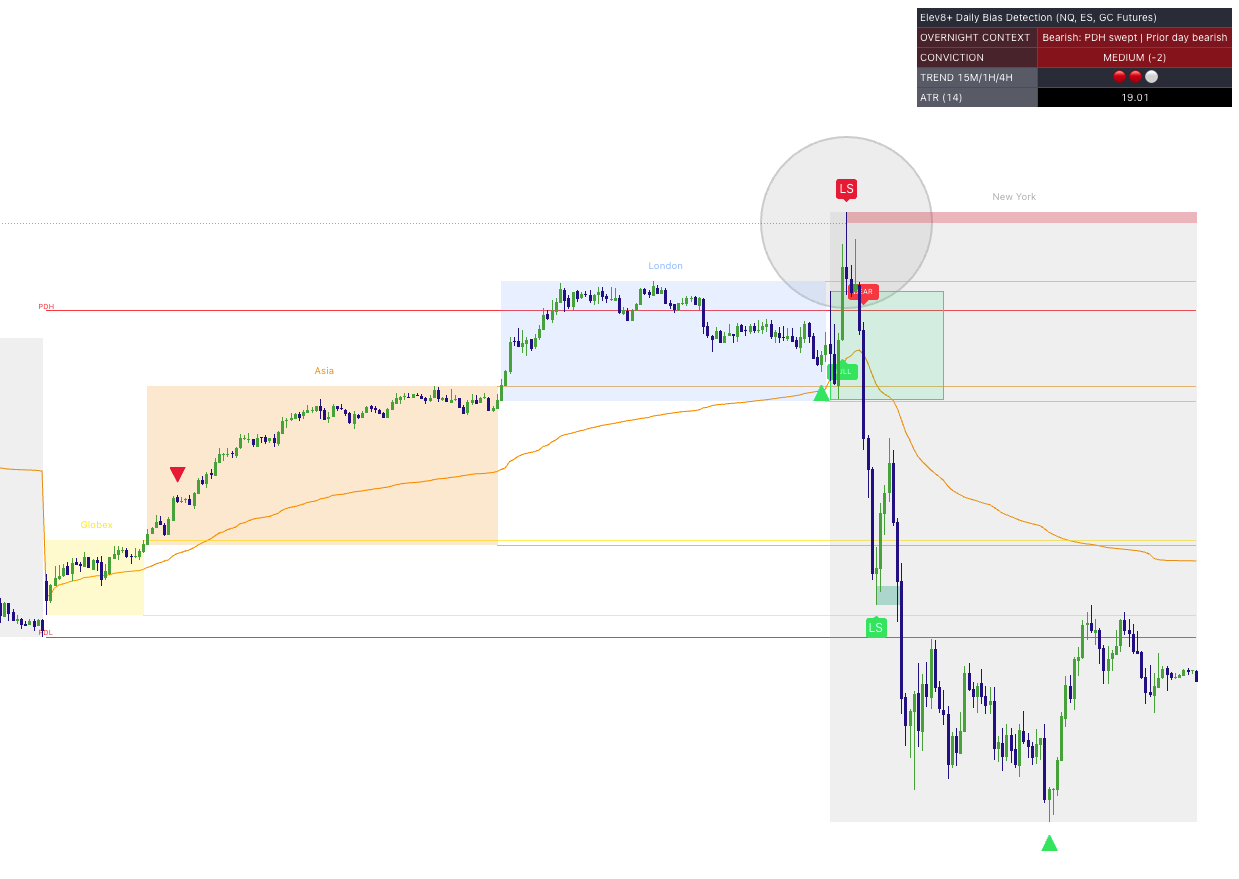
Pro trigger integration
The highest-quality sweeps are the ones where the Pro triangle prints after the reclaim, not while price is still sweeping. Let the level prove itself first.
Image 3: Session sweep + Pro triangle trigger
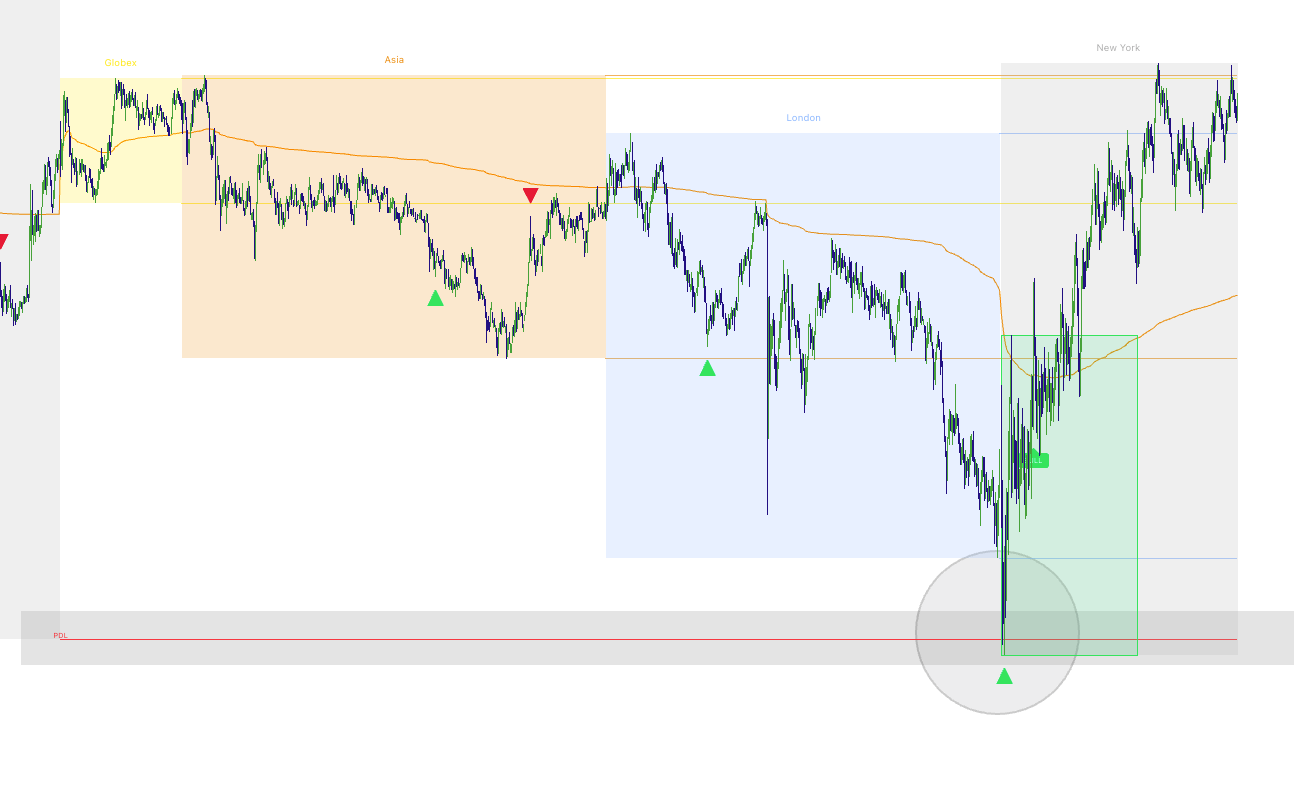
Step 2: PDH/PDL — The Daily “Line in the Sand”
Market Map plots PDH (Prior Day High) and PDL (Prior Day Low) and extends them forward. These are two of the cleanest references for: breakout attempts, sweep traps, daily range expansion days, and “reclaim = bias shift” behavior.
Image 4: PDH/PDL plotted with a clean reaction
PDH/PDL strategies (simple and effective)
1) PDH/PDL Sweep + Fail (trap reversal)
This is the classic “liquidity grab” behavior. Price runs stops above PDH or below PDL, then fails back into the prior day range. When that failure happens, the market often rotates back toward the range. These are A+ setups when price is also stretching into a Market Extreme zone or a HTF Order Block, or FVG shown in Momentum Gaps.
- Bearish trap: sweep PDH → fail back below PDH → Pro sell triangle becomes your trigger.
- Bullish trap: sweep PDL → reclaim above PDL → Pro buy triangle becomes your trigger.
2) PDH/PDL Break + Acceptance (trend day behavior)
Sometimes PDH/PDL doesn’t trap—price breaks and holds. When that happens, PDH/PDL often becomes a support/resistance flip zone. Treat it like a “line in the sand” that defines whether the day is accepting higher or lower prices.
- Acceptance above PDH: bias often shifts bullish; look for pullbacks holding above.
- Acceptance below PDL: bias often shifts bearish; look for pullbacks holding below.
Image 5: PDH/PDL sweep vs acceptance comparison
Step 3: ORB Pro — Opening Range Breakouts (Pre-Market + NY Open)
The ORB Pro module draws opening range boxes that define a clear “decision zone” early in the day. This matters because ORB highs and lows often act as short-term support/resistance, and breaks can kick off the next push in the session.
Market Map includes six ORB windows you can enable:
- Pre-Market 15m and Pre-Market 30m
- NY Open 15m and NY Open 30m
- London Open 15m and London Open 30m
Each ORB can optionally plot:
- 50% midline (useful for “who controls the range” context),
- Projected TP levels (1x and 2x of the ORB range) for clean structure-based targets.
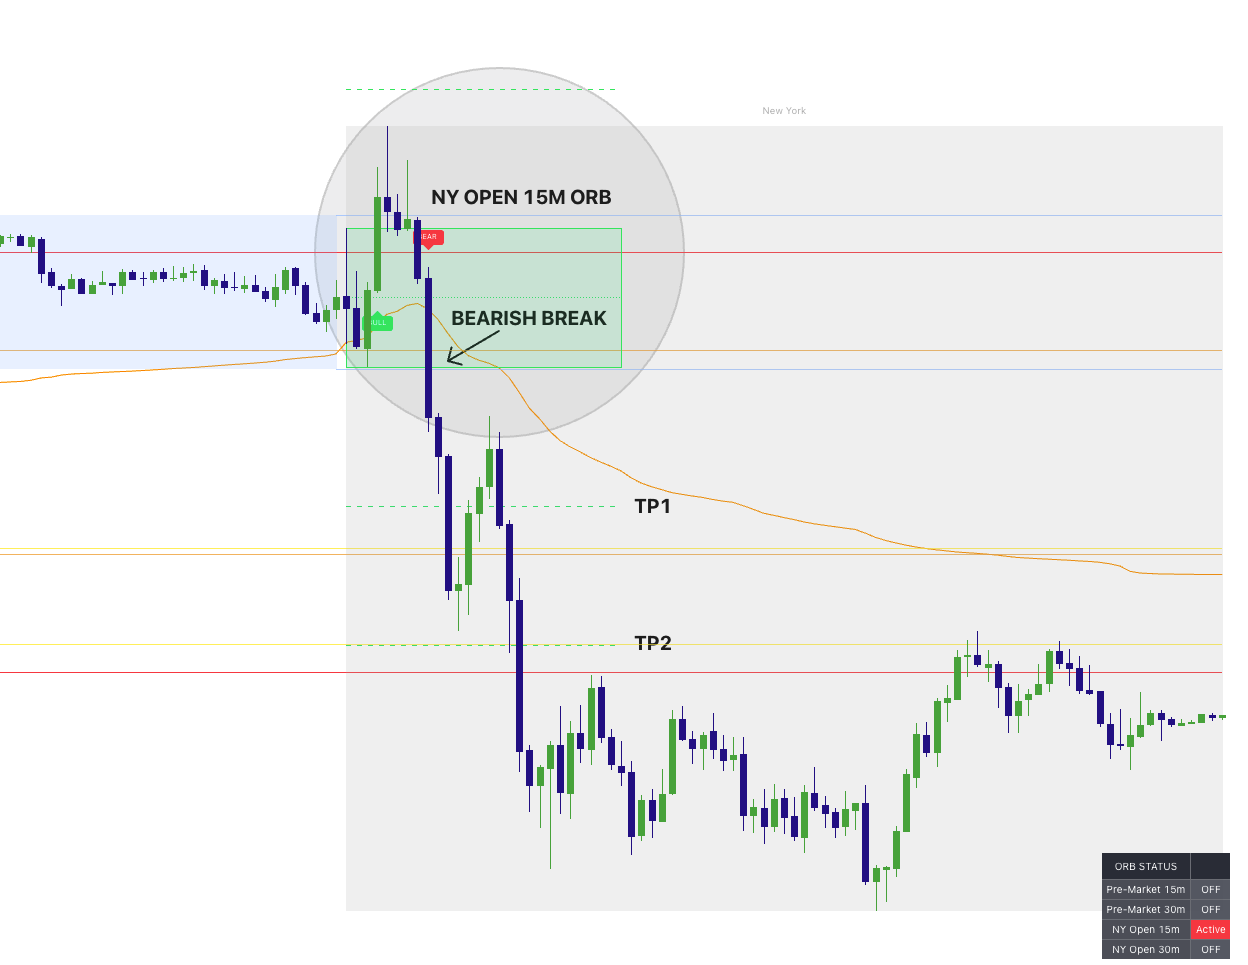
Image 6: ORB boxes (NY 15m + optional midline + TP levels)
ORB breakout strategy (the clean playbook)
The goal is not to “predict” direction. It’s to let the market define a range, then trade the break when it proves itself.
- Step 1: Let the ORB complete (the box is your opening range).
- Step 2: Wait for a break and a hold outside the range.
- Step 3: Use the ORB high/low as a reference for invalidation or retest entries.
- Step 4: Use 1x/2x projections as structure-based target zones (not guarantees).
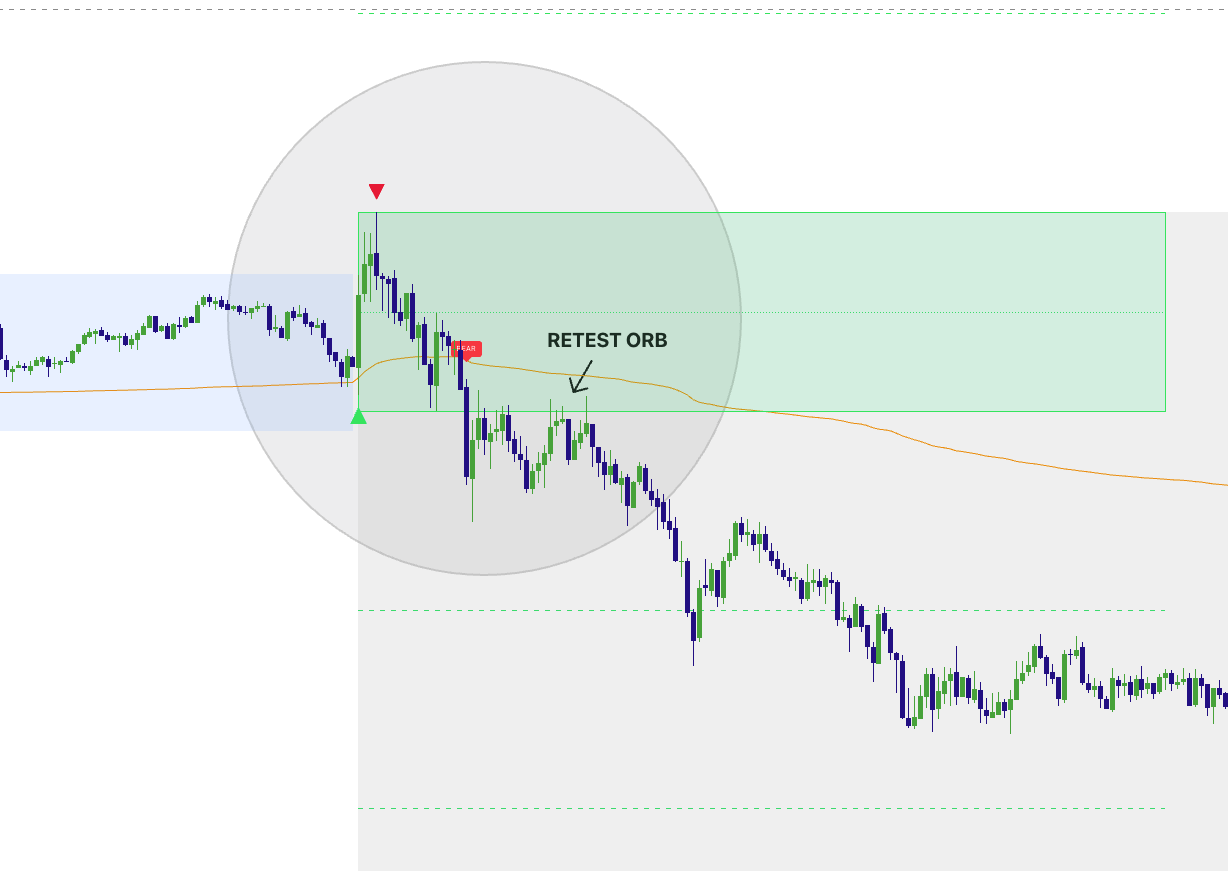
ORB continuation (break + retest)
One of the cleanest ORB plays is the retest:
- Bullish: break above ORB high → pull back → hold ORB high as support → continue higher.
- Bearish: break below ORB low → pull back → hold ORB low as resistance → continue lower.
ORB failed breakout (trap + reversal)
If price breaks out and immediately fails back inside the ORB range, you treat it as a trap. This is where you look for your Pro triangle trigger back toward the opposite side of the box.
- Bull trap: break above ORB high → fail back below → short bias back into range.
- Bear trap: break below ORB low → reclaim above → long bias back into range.
Image 7: ORB break + retest entry (with Pro triangle)
ORB Alerts (so you don’t miss the break)
Market Map includes optional alert conditions for each ORB breakout direction. This is useful if you want to be notified when a breakout occurs—without staring at the chart.
Alert setup
In TradingView, create an alert on the Market Map script and select the ORB condition you want (NY 15m bull/bear, NY 30m bull/bear, Pre-Market 15m bull/bear, Pre-Market 30m bull/bear). Choose your preferred alert delivery method (popup/app/webhook).
Step 4: Session Fib Lines — Intraday Support/Resistance Map
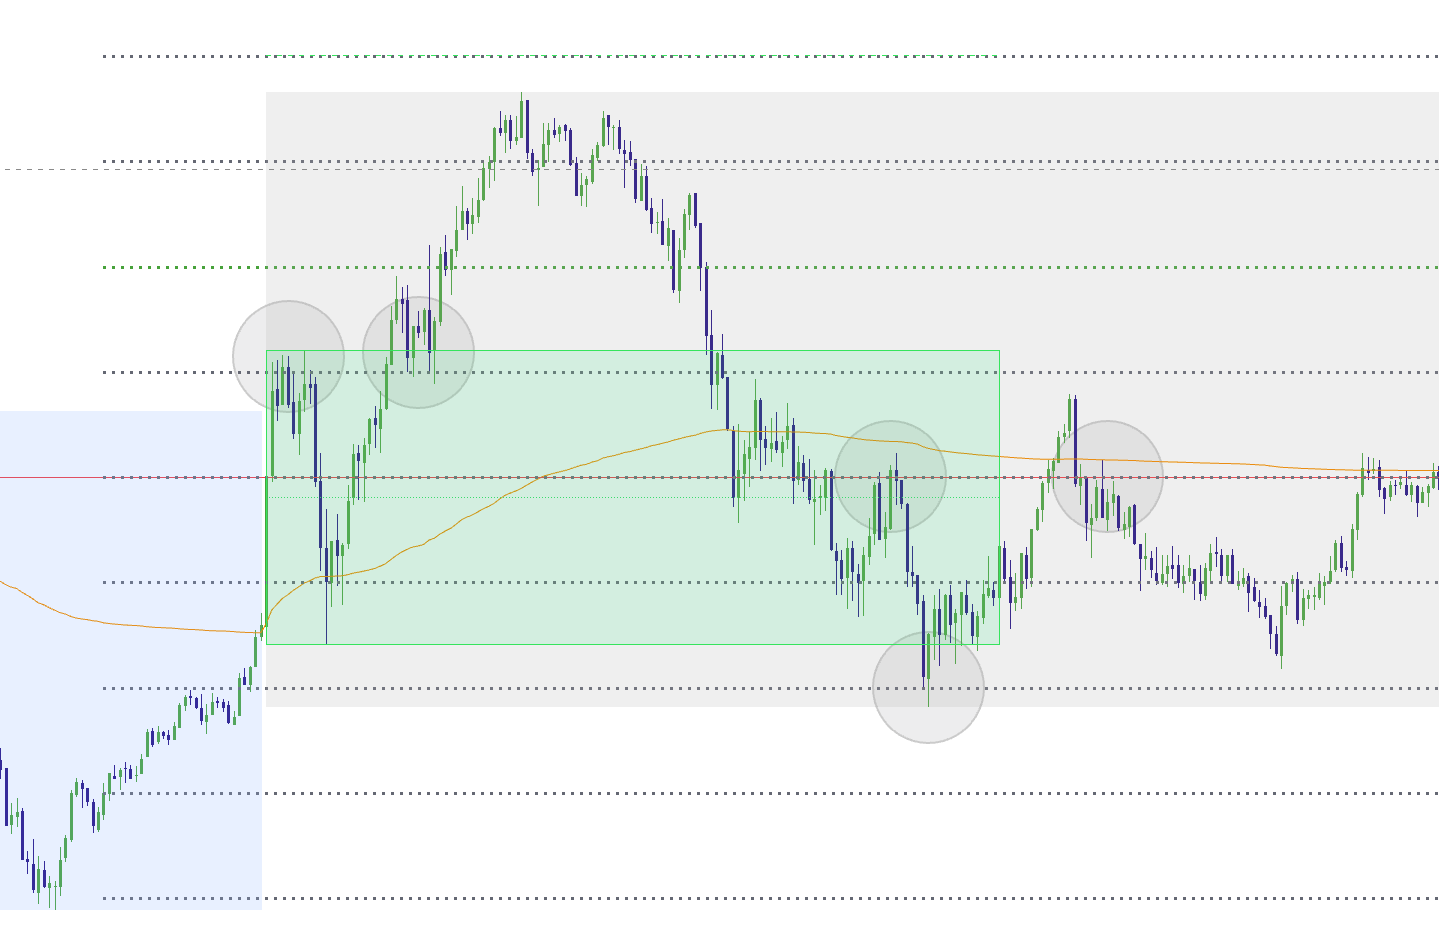
The Session Fib Lines are an optional add-on designed to create consistent intraday reference lines after the early session builds. Traders often notice that price “respects” repeated horizontal levels—especially on active futures indices. These lines can act as:
- intraday support/resistance reaction points,
- pause-and-rotate areas,
- and structured target zones during trends.
The key is how you use them: treat them as reaction zones, not automatic entries. When price approaches a fib line, you wait for confirmation (rejection, hold, or your Pro trigger).
Image 8: Session Fib Lines acting as intraday reaction levels
How to trade fib lines (two clean approaches)
A) Reaction + Pro trigger (reversal)
- Price tags a fib line.
- Price stalls or wicks (rejection).
- Pro triangle appears in the direction of the reversal.
- Invalidation is defined beyond the fib line / recent swing.
B) Hold + continuation (trend support/resistance)
- Price breaks a fib line with clean closes.
- Pullback retests and holds the fib line as a flip zone.
- Continuation resumes in the direction of the break.
Important
Fib lines are best treated as structure. Your edge comes from combining them with context (sessions, PDH/PDL, ORB) and a trigger (Pro triangles), not from taking blind entries on touches.
Step 5: The Context Dashboard — Your Daily NY Open Bias Snapshot
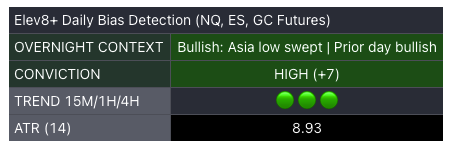
One of the most useful features in Market Map is the daily context dashboard. Every trading day, it produces a New York open bias snapshot based on the overnight structure and the prior day’s behavior. The dashboard is designed to keep your plan simple:
- Overnight Context: a short narrative label explaining what the overnight session implies.
- Conviction: a quick confidence band (LOW / MEDIUM / HIGH) with a signed score.
- Trend alignment: quick icons for 15m / 1H / 4H moving average direction.
- ATR(14): a volatility read to calibrate expectations.
Image 9: Daily Bias Context Dashboard at NY open
How to use the daily bias correctly
The dashboard is not telling you “take a trade now.” It’s telling you what type of day you should be mentally prepared for. Here are the practical rules:
- High conviction: prioritize trades that align with the bias; be more selective fading the trend but don't always rely on the overnight bias to be right everyday, especially if NY open shows a clean sweep fading the bias.
- Low conviction: expect chop/rotation; focus on sweeps, mean reversion, and clean triggers at levels.
- Neutral: treat the day as “prove it first” and wait for the market to show its hand.
Putting It All Together: Three High-Probability Playbooks
Playbook 1: ORB Breakout Day (structure-based trend)
- Context: Daily dashboard shows bullish or bearish tilt.
- Trigger: ORB breaks and holds outside range.
- Entry idea: retest of ORB boundary + optional Pro triangle for timing.
- Targets: 1x/2x ORB projections + next key session H/L + PDH/PDL.
Playbook 2: PDH/PDL Trap Day (sweep + reversal)
- Context: price sweeps PDH/PDL early, then fails back inside.
- Trigger: Pro triangle after reclaim.
- Targets: prior session midpoint / VWAP / opposite side of range.
Playbook 3: Session Liquidity Reaction Day (London/Asia levels)
- Context: price is repeatedly reacting at Asia or London highs/lows.
- Trigger: sweep + reclaim (fade) or break + hold (continue).
- Execution: use Pro triangles only at the mapped level or on the retest.
Image 10: “Full confluence” example (sessions + PDH/PDL + ORB + Pro)
Suggested Settings (Start Here)
Market Map defaults are designed to be plug-and-play. If you’re new, start with this simple setup:
- Sessions: Asia + London + New York ON
- Extend Session High/Low Lines: ON
- PDH/PDL: ON
- ORB: NY Open 15m ON (start there), add NY 30m if you prefer wider opening ranges
- ORB Labels: ON (Bull/Bear)
- Session Fib Lines: OFF initially (turn on once you’re comfortable with the base map)
- Dashboards: ON (Context + ORB)
Common mistakes (and the fix)
• Mistake: Trading mid-range candles. Fix: only take trades at mapped levels when liquidity is swept.
• Mistake: Fading strong acceptance. Fix: if it breaks and holds, treat it as continuation.
• Mistake: Taking Pro triangles anywhere. Fix: prioritize Pro triggers at sweeps/reclaims/ORB boundaries.
• Mistake: Too much clutter. Fix: enable features gradually (start with sessions + PDH/PDL + NY15 ORB).
If you cannot define “why here” and “where am I wrong,” it is not a Market Map trade—only a guess.
Want to trade with a map instead of guessing?
Use Elev8+ Market Map to define the day’s structure (sessions, PDH/PDL, ORB ranges, fib reactions), then use Elev8+ Pro reversal triangles as your trigger at the best locations. This is how you reduce random entries and improve consistency.
Indicators and examples are for education only. Always define risk and trade only what fits your plan.