New Release • Market Exhaustion + Extremes
Elev8+ Market Extremes: Find Exhaustion Areas and Time Higher-Quality Reversals
Most traders don’t struggle to find trades—they struggle with timing. Elev8+ Market Extremes helps you identify when buyers or sellers are getting stretched and likely to pause, rotate, or mean-revert. Use it as your context layer, then use Elev8+ Pro reversal triangles as your execution trigger—especially when price reaches statistically extreme zones.
Educational content only. Not financial advice. No performance guarantees.
Core idea
Extremes matter most at location. Market Extremes flags when a move is stretched, so you stop chasing and start waiting for high-quality rotation.
What you get
A smoothed Exhaustion Index (0–100), HTF 3–4 Standard Deviation price walls, and optional divergence lines for additional confluence.
Best combo
Use Market Extremes as context, then take Elev8+ Pro triangles as the trigger only when price is at an extreme zone.
Example 1: Buyer exhaustion + rejection wick (NQ • 1m/5m)
What Is Elev8+ Market Extremes Actually Measuring?
Market Extremes blends three practical inputs into a single “Exhaustion Index” (0–100). It’s not meant to be a generic overbought/oversold oscillator—it’s built to detect stretch + pressure + rejection in real time:
1) Momentum Base (RSI Core)
A momentum baseline (default 14) acts as the foundation for trend “temperature.” Strong momentum keeps the index elevated in bullish phases and depressed in bearish phases.
2) Volume Pressure (Relative to Baseline)
Volume is compared to its baseline (default 20). When volume expands beyond your Exhaustion Threshold, it boosts the index in the direction of the current momentum—useful for detecting “final push” behavior.
3) Wick Rejection (Buyer/Seller Failure)
Large wicks are the market telling you “we tried to continue, but got rejected.” Upper wick rejection contributes to buyer exhaustion; lower wick rejection contributes to seller exhaustion.
How to use it correctly
Treat Market Extremes as a context filter. It highlights when continuation is becoming risky and reversal setups become higher probability—especially at key locations like PDH/PDL or Previous Session High/Lows.
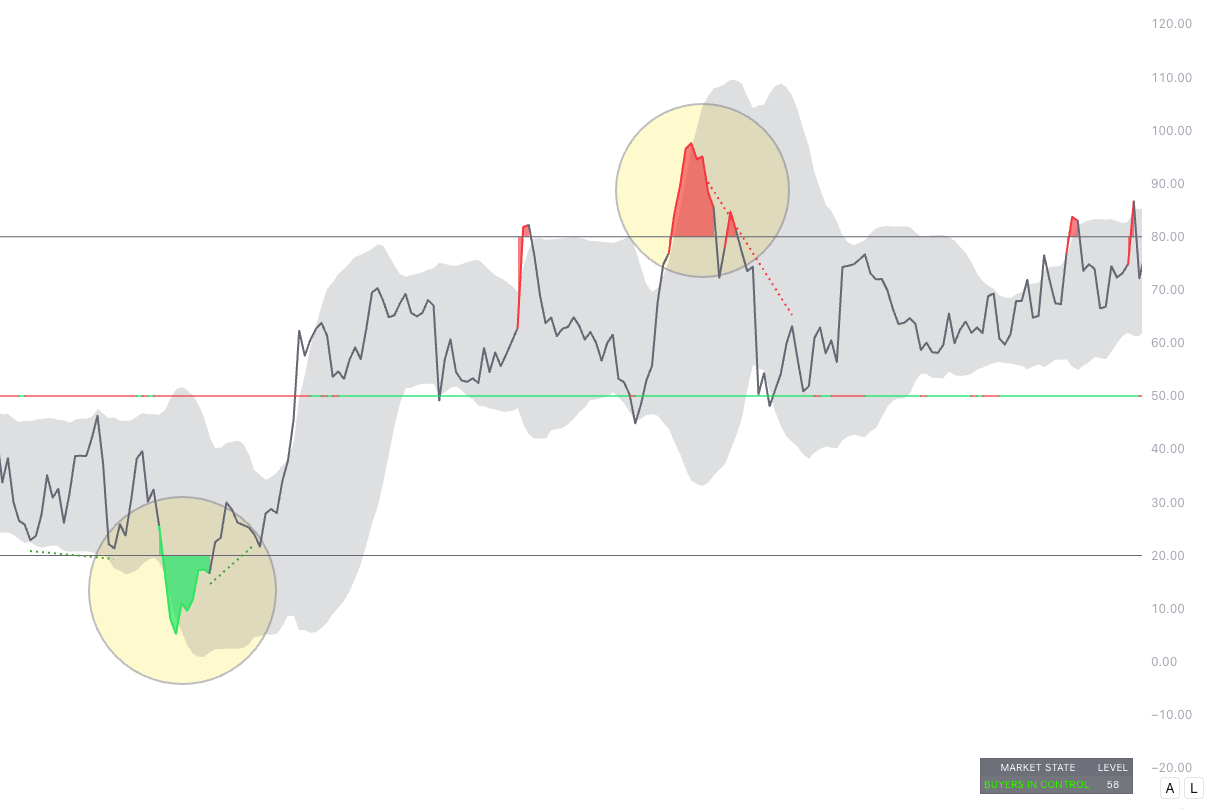
How to Read the Exhaustion Index (0–100)
The Exhaustion Index is smoothed and displayed with bands. The key zones are simple:
- Above 80 = Buyer Exhaustion (upside stretch; fading becomes more viable if location supports it)
- Below 20 = Seller Exhaustion (downside stretch; bouncing becomes more viable if location supports it)
- Mid-zone = trend/control context (avoid forcing reversals mid-range)
Example 2: Exhaustion Index crossing 80/20 (Oscillator panel)
CMF Midline: Flow Confirmation (helps avoid fading strong pressure)
Inside the oscillator panel you’ll also notice a colored CMF Midline around the 50 level. This is a quick “flow check” that helps you judge whether the current push is supported by underlying buying/selling pressure.
- Green-ish midline = money flow is positive (buyers have better control / bids are supporting the move).
- Red-ish midline = money flow is negative (sellers have better control / offers are dominating).
The best way to use it is as a filter, not a standalone signal:
- If you’re in Buyer Exhaustion (> 80) at a premium wall, and the CMF midline is red (or flips red), that’s added confirmation that the upside push is weakening.
- If you’re in Seller Exhaustion (< 20) at a discount wall, and the CMF midline is green (or flips green), that’s added confirmation that selling pressure is fading.
- If CMF stays strongly aligned with the trend (green during highs / red during lows), treat exhaustion as a warning and wait for clear rejection + your Elev8+ Pro trigger instead of forcing early fades.
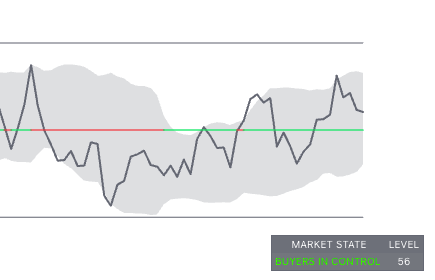
The Dashboard: Instant Market State
The dashboard summarizes the current “market state” so you don’t need to interpret every wiggle:
- BUYER EXHAUSTION when the index is stretched high
- SELLER EXHAUSTION when the index is stretched low
- BUYERS IN CONTROL or SELLERS IN CONTROL in the trend-control zones
- NEUTRAL in transition
Example 3: Dashboard “Market State” snapshot
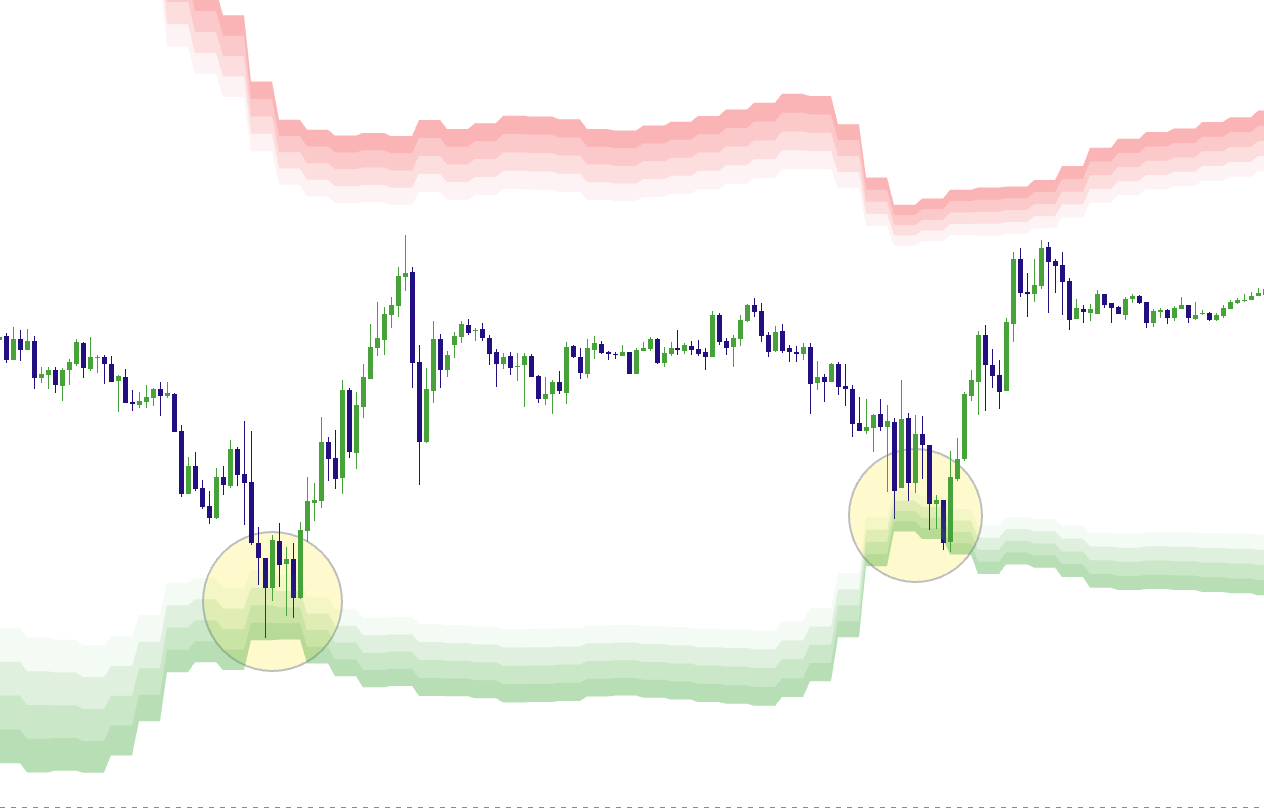
HTF “Price Walls”: Where Extremes Tend to React
Market Extremes can project higher-timeframe statistical extremes onto your chart using 3.0–4.0 standard deviation zones. These zones act like price walls where continuation often slows and reversals/rotations become more likely.
- Red gradient zones above = premium extremes (sell-side wall)
- Green gradient zones below = discount extremes (buy-side wall)
Why this matters
The best reversal trades are rarely random. They usually happen when price is extended and at a meaningful location. Walls solve the “location” problem.
Example 4: Price tags a 3–4 SD wall zone (Top chart)
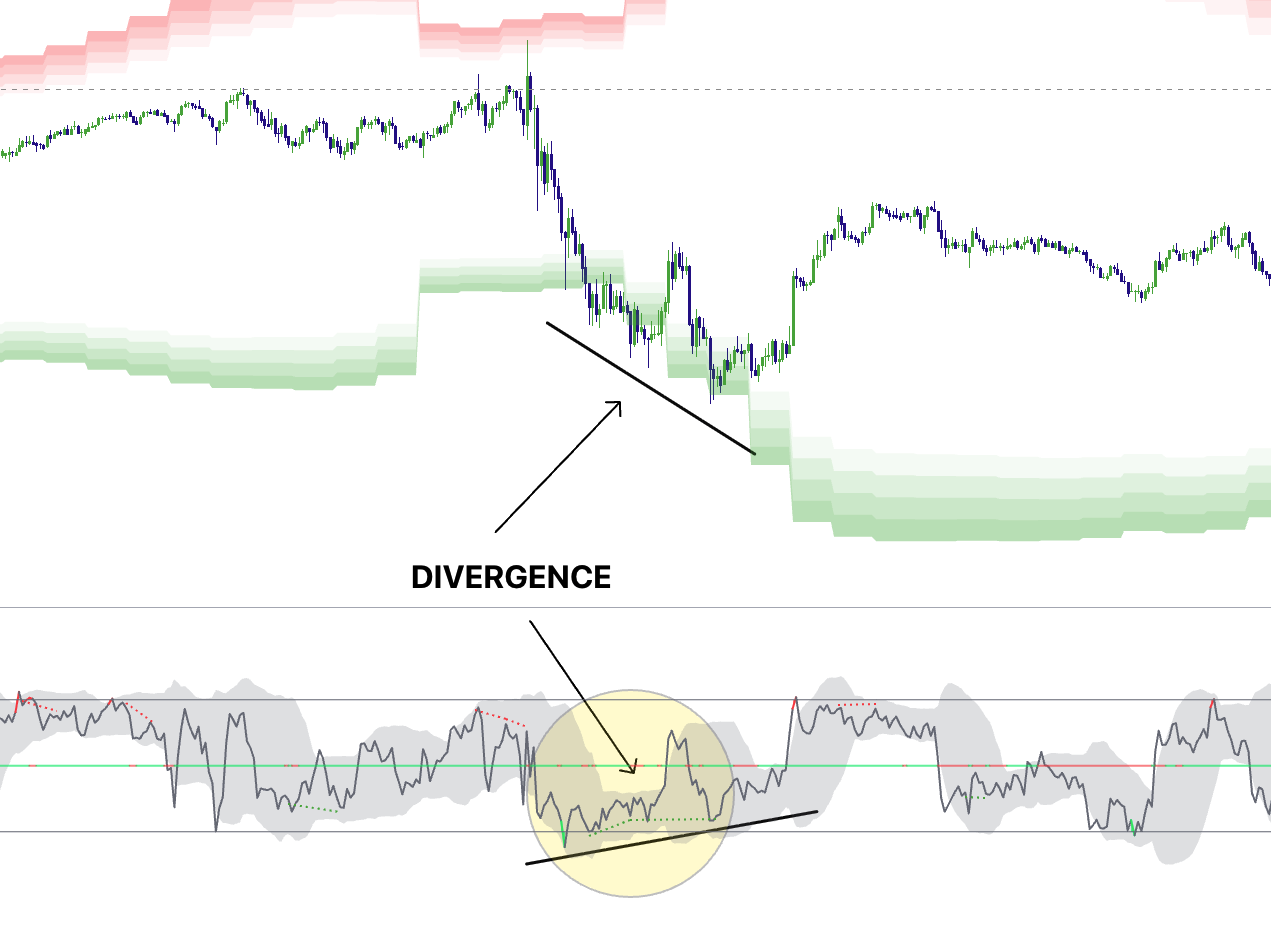
Divergence Lines: When Momentum Disconnects From Price
The divergence module looks for strict pivot-confirmed divergence:
- Bearish divergence: price makes a higher high while momentum makes a lower high
- Bullish divergence: price makes a lower low while momentum makes a higher low
Divergence is not required, but it’s a high-value bonus when it prints at a wall during exhaustion.
Example 5: Divergence at an extreme zone
The Best Way to Trade It: Context First, Trigger Second
Market Extremes is not a “buy/sell button.” It’s a filter that tells you when reversals become more viable and when chasing becomes risky. Your execution should still come from Elev8+ Pro reversal triangles at the right location.
The rule
Market Extremes = context. Elev8+ Pro = trigger. Only prioritize Pro signals when they appear at extremes (walls + exhaustion).
Two High-Probability Playbooks
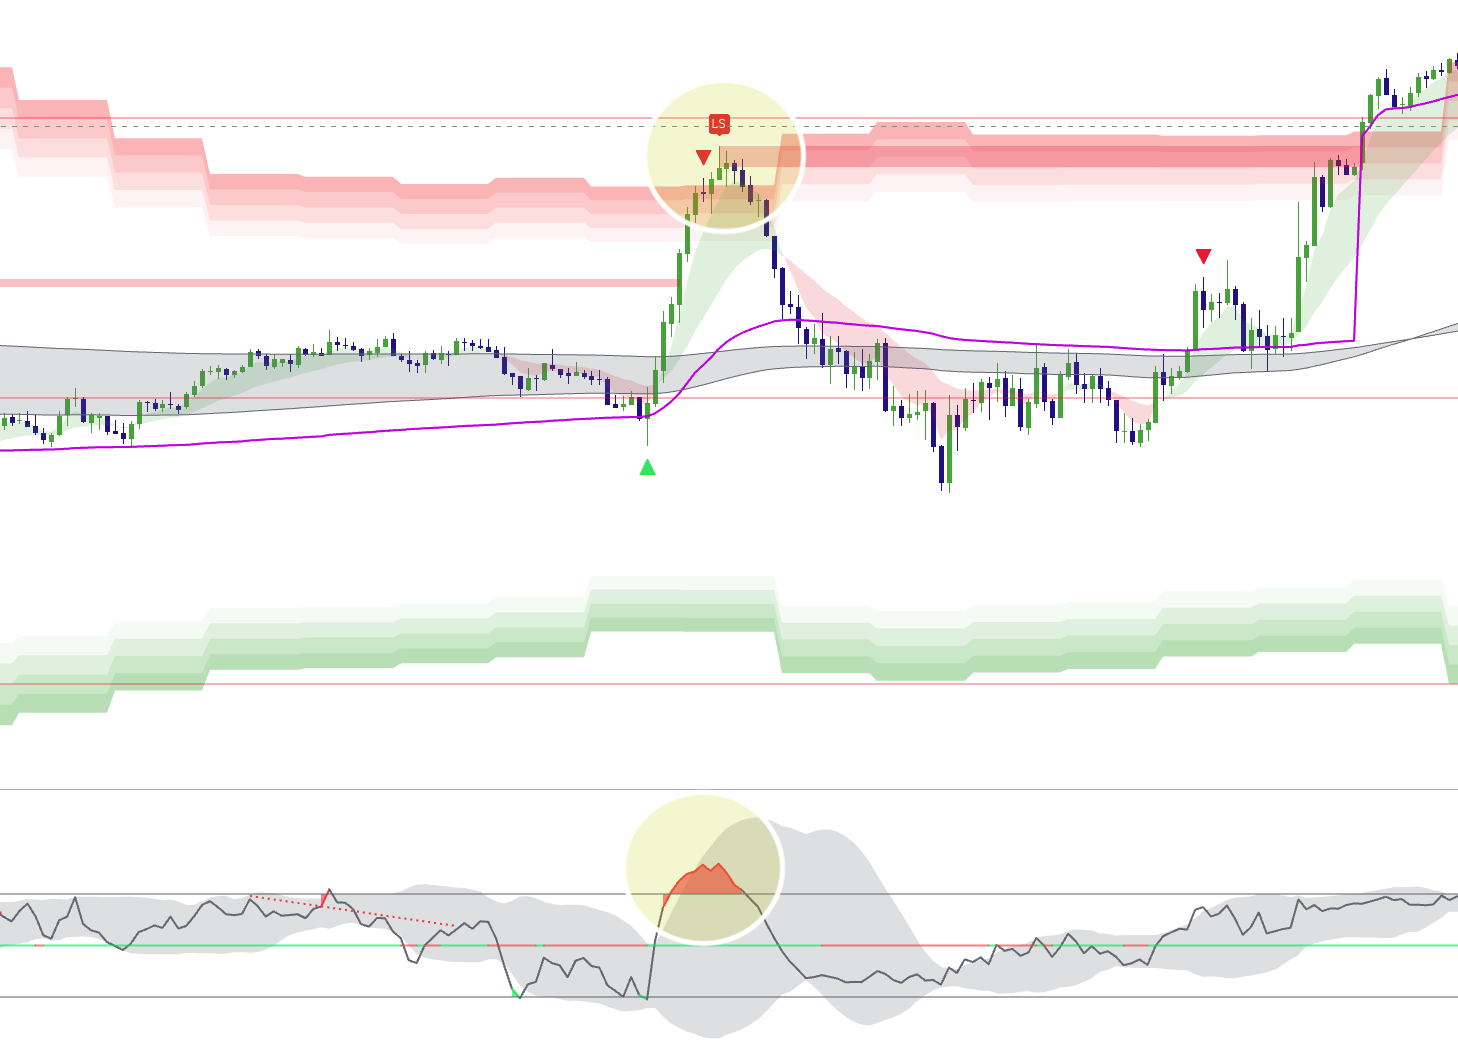
1) Bearish Reversal at Premium (Buyer Exhaustion)
- Location: price tags the red wall zone (3SD+ premium)
- Condition: Exhaustion Index pushes above 80
- Bonus: If price is at a 1h/4h resistance level
- Trigger: Elev8+ Pro reversal triangle prints near the wall
- Invalidation: beyond the extreme high / beyond the wall edge
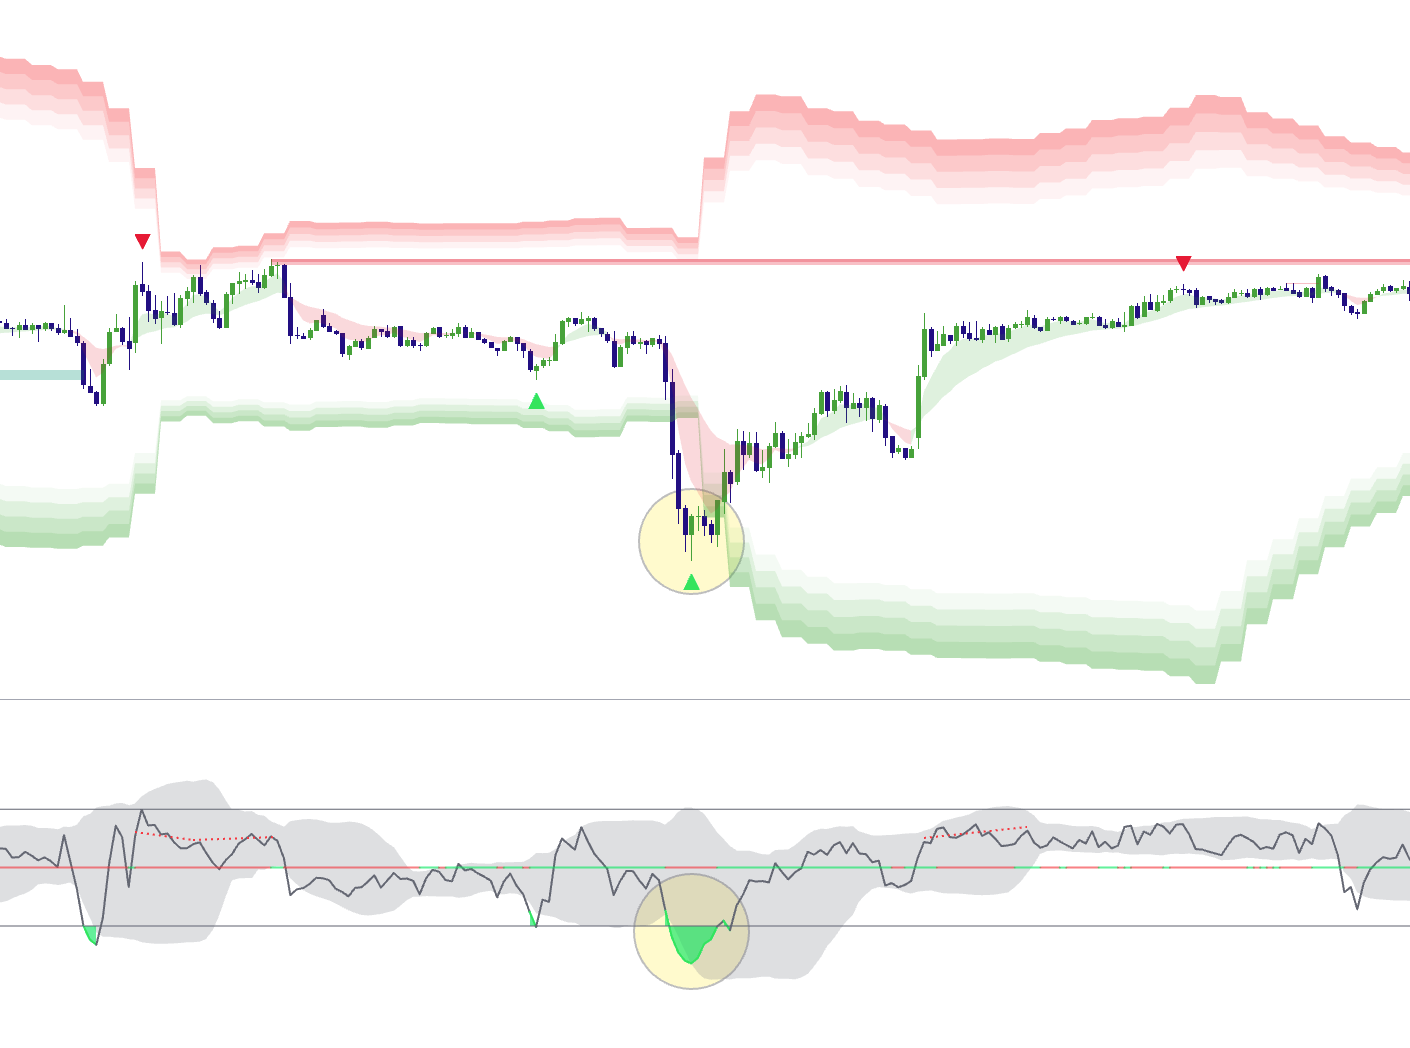
Example 6: Full bearish confluence (Walls + Exhaustion + Pro trigger)
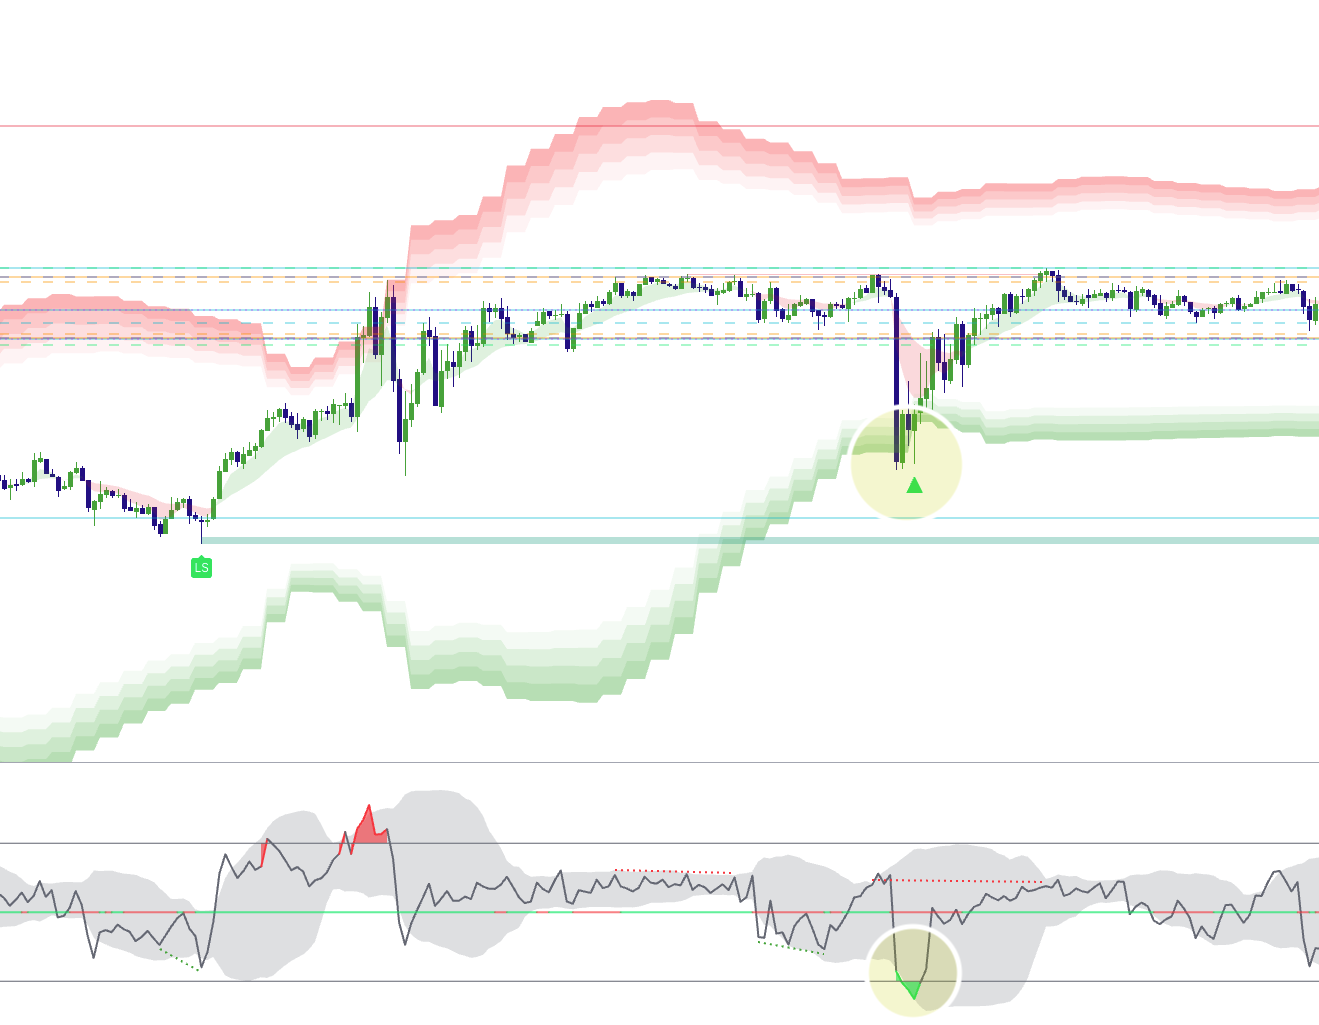
2) Bullish Reversal at Discount (Seller Exhaustion)
- Location: price tags the green wall zone (3SD+ discount)
- Condition: Exhaustion Index drops below 20
- Bonus: Price is sweeping a PDL or Previous Session Low
- Trigger: Elev8+ Pro reversal triangle prints near the wall
- Invalidation: beyond the extreme low / beyond the wall edge
Example 7: Full bullish confluence (Walls + Exhaustion + Pro trigger)
Extremes Checklist (use this before entering)
• Price is at/inside a 3SD+ wall zone (premium or discount).
• Exhaustion Index is above 80 (bear) or below 20 (bull).
• You see rejection (wicks / failed continuation / stall).
• Pro triangle prints near the extreme (not mid-range).
• Invalidation is clear beyond the extreme.
• You’re not fading strong acceptance/continuation behavior.
Example: Price pushes up into a Market Extremes Sell Zone and prints a triangle sell signal. Stop loss beyond the wick of the signal candle. Target VWAP/London high retest for A+ trade betting on a reversion to the mean after being overextended.

If you cannot define invalidation, you do not have an extremes trade—only a guess.
How to Avoid the Biggest Mistake: Fighting Real Continuation
Exhaustion does not guarantee a reversal. Sometimes the market stays strong and builds acceptance. Use these warning signs to avoid forcing counter-trend trades:
- Multiple closes holding outside the wall edge (not just wicks)
- Pullbacks that hold the wall zone as support/resistance (clean level flip)
- Expansion candles continue printing in the same direction with no stall
Decision Tree (simple)
Step 1: Are we at a 3-4SD+ wall zone?
Step 2: Is the Exhaustion Index in an extreme (above 80 / below 20)?
Step 3: Do we see rejection (stall, wick rejection, failed continuation)?
If YES: wait for a Pro triangle and define invalidation. (check multiple timeframes)
If NO: treat it as continuation risk—do not force reversals.
Suggested Settings (Start Here)
Defaults are designed to be plug-and-play for most traders:
- Momentum Base: 14
- Volume Baseline: 20
- Exhaustion Threshold: 1.5 (raise for fewer “extreme” readings)
- Pivot Lookback: 5 / 5 (raise for fewer divergence prints)
- Show Price Walls: On
- Show Dashboard: On
Common Mistakes (and the Fix)
- Mistake: Treating 80/20 as an auto-entry. Fix: use it as context, then wait for Pro trigger.
- Mistake: Taking Pro triangles mid-range. Fix: prioritize triangles only at walls + extremes.
- Mistake: Wide stops on a “tight-risk” setup. Fix: if invalidation is far, the setup isn’t clean.
- Mistake: Ignoring acceptance. Fix: if price holds outside the wall with closes, step aside.
Want to see Market Extremes in action?
Use Market Extremes to identify statistically stretched areas, then use Elev8+ Pro reversal triangles as the execution trigger. This combination helps you avoid chasing late and focus on trades with defined risk at meaningful locations.
Indicators and examples are for education only. Always define risk and trade only what fits your plan.